Advertisers Move Spend To Android

3f96fbbe-17a0-4e24-9bf3-81eeb1b86443 (1).png

Advertisers Move Spend To Android While iOS Revenue Declines 

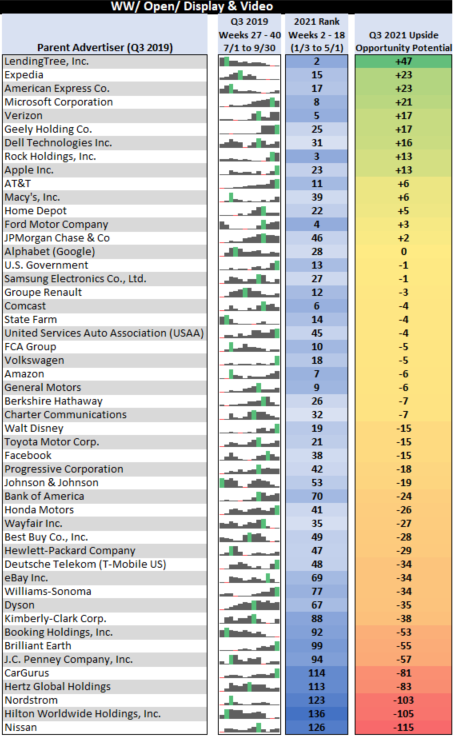
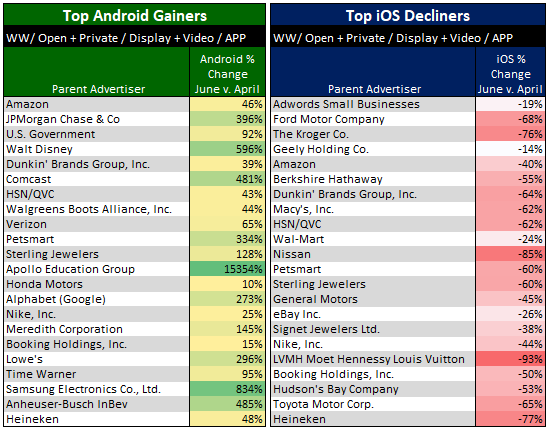
With the continued adoption of iOS 14.5+, we’ve begun to see a trend of advertisers moving more of their spend to Android and away from iOS. AmazonDunkin'Booking, and Heineken have each made significant shifts, increasing Android spend by 20-50% and decreasing iOS spend by 40-80%. It's likely these advertisers may be targeting Cookies rather than specifically targeting Android users. But regardless, it’s a trend we’ll continue to follow and report on as buyers evolve how they track users.

ae0676fa-e962-c896-9a1b-c0345eb70fc4.png

At A Glance:

  • Displaying the fastest growth on Android, in just the last month Walgreens is up 128%, Lowe's is up 400%, and Petsmart is up 710%.

  • Since April, the Travel category is up 10% on Android and down 40% on iOS, and Computers & Electronics is up 30% on Android and primarily flat on iOS.

  • We also observed advertisers outside of this list who decreased spend on both Android and iOS, implying they may be avoiding mobile inventory completely. We'll share updates if this trend continues.

Christmas In July For Desktop CPMs

3f96fbbe-17a0-4e24-9bf3-81eeb1b86443 (1).png

Desktop CPMs Rising Like It's Christmas 2019, While Impressions Hit A 3-Year Low

As the US opens back up and consumers spent more time on mobile devices, Desktop inventory has dropped 25% since Q1, while CPMs have grown exponentially.

Since April, Desktop CPMs have grown 3% each week, reaching levels we haven't seen since Holiday 2019.

We'll see if this trend continues into the rest of the summer and Q3.

bdab4cc0-f48b-a608-90e0-c2e88f7bc464.png

At A Glance:

  • The Open market is behaving as expected as apparent Desktop scarcity drives rising CPMs, up 17% from Q1 and reaching their highest levels since Q4 2019.

  • Pro Tip: Despite Google delaying their Cookie deprecation, its important to start looking deeper into device trends at the browser level in order to identify opportunities to improve your CPMs. We'll keep you updated with our analysis.

CPM Growth A Good Sign For Q3

3f96fbbe-17a0-4e24-9bf3-81eeb1b86443 (1).png

Chrome Active CPMs Growing Fast

Regardless of ongoing industry changes, Publisher CPMs have continued to grow in Q2. Even with adoption of iOS 14.5+ increasing weekly, Q2 CPMs are 10% higher than Q2 2019 levels and continue to grow. This market resilience is a good sign for a strong end of Quarter and positive Q3.

596c2554-793d-121a-ef84-b512ab8af1f9.png
5a38cae1-88cd-7db7-5c38-89afa6995153.png

*The above chart represents the average CPM and Share from weeks 2-24.

At A Glance:

  • Active CPMs are 296% higher than Restricted on Chrome, and 120% higher on Safari, however the Restricted share on Safari makes up 65% and continues to grow W/W.

Advertisers Want Guarantees Over Flexibility

3f96fbbe-17a0-4e24-9bf3-81eeb1b86443 (1).png

Flexibility becoming less important to advertisers as Guaranteed deals continue to increase

Since the beginning of the year we've seen an increase in spend coming through Programmatic Guaranteed (PG) deals. This influx is coming from a mix of advertisers new to PG, and those that have come back or shifted spend away from the Open market, which was highly valued for its flexibility throughout 2020. 

89223e00-fb96-071c-036b-a0439ce02494.png
  • New PG spenders: Lions Gate, Sterling Jewelers, Exxon and adidas all up 100% Q/Q. Coty, GM and Esteé Lauder are up 500% Q/Q.

  • Largest shift to PG Q/Q: FCA up 150%, Diageo up 162%, Nintendo and Disney up 200%, HP up 264%, and Dell, Apple and Nissan all up 500%.

Q3 Prospecting Report

3f96fbbe-17a0-4e24-9bf3-81eeb1b86443 (1).png

Get Ahead In Q3:

A Look At 2019 Top Q3 Advertisers

We’ve pulled a list of the Top 50 spenders from Q3 2019 (reminder of the consensus that 2020 is an impractical comparison for 2021). We hope you find this helpful in identifying potential opportunities in the coming quarter.

As a valued Benchmarking partner, if your data is available, you will also receive a more detailed custom report that includes your share of the top advertisers’ Q3 2019 spend. Here's to a successful Q3!

43cfb2bf-ebe9-4bb0-8ca8-26fc437486fa.png

**The green bar represents the advertiser's Peak Revenue Week

This chart represents a typical mix of Q3 advertisers and a good indication of those likely to spend heavily this year. Some advertisers here like in Travel, are still emerging from covid related decreases and continue to pick up momentum W/W. Additionally, there are advertisers absent from this list that we've seen significantly increase spend in 2021, and may be poised to continue into Q3.

New To The Top 50 In 2021: 

  • Discovery: 102 --> 16

  • Capital One: 88 --> 20

  • Adobe: 56 --> 24

  • Uber: 51 --> 30

  • Qurate Retail --> 69 --> 36

  • LVMH: 80 --> 37

  • Viacom: 176 --> 40

  • Metlife: 129 --> 44

At A Glance: 

  • Keeping it streaming, Entertainment advertisers displaying some of the largest new opportunities (over 2019) with Viacom up 136 spots to #40, and Discovery rising 86 spots to #16.

  • Making steady W/W gains over the last 4 weeks, AmEx rose to the #17th spot, and CapOne gained a significant 68 places over 2019 in the #20th spot.

  • Dell has shown steady W/W increases since January, rising to the #31st spot. Microsoft has been a consistent spender since Feb, gaining 21 spots over 2019 to the #8th spot.

CPMs Rise Amid More Ad Spend

3f96fbbe-17a0-4e24-9bf3-81eeb1b86443 (1).png

CPMs Rise Amid More Ad Spend

Whatever it is, the way you tell your story online can make all the difference.

Whatever it is, the way you tell your story online can make all the difference.

CPMs increased throughout April, ending 9% above 2019 levels. Perhaps a driver is the flock of smaller advertisers in Travel, Beverages, etc. continuing to spend more, and existing advertisers like in Auto, whose spending remains strong. Furthermore, early indications suggest that iOS 14.5 has not disrupted this positive trend yet, and we are keeping a close eye as 14.5 gradually rolls out across the ecosystem.

  • CPMs showed positive momentum in March, ending 3% above 2019 levels.

  • So far in Q2, CPMs are 28% over Q1 levels, while in 2019 Q2 was 19% higher than Q1 over the same time period.

  • In 2019, Q2 began with a 16% CPM drop, while Q2 2021 only displayed a 5% decline and continues to show positive W/W increases.

Prepare For Advertisers To Re-Open Spend

3f96fbbe-17a0-4e24-9bf3-81eeb1b86443.png

Get Prepared For These Advertisers To Start Re-Opening Spend 

As things begin to open up and return to some pre-covid activities, we've seen the reappearance of more advertisers in categories like Beverages, Entertainment, Travel, Retail and Restaurants. Included are selected gainers primarily outside the Top 50 who hit their highest spending weeks of the year so far last week. 

5b0c3977-d0c6-4d16-9a58-bac8c5825bd5.png
  • DPSG started spending for the first time this year last week, and Anheuser has steadily increased W/W since returning a few weeks ago. Heineken is up 31% W/W. Just in time for bars to reopen.

  • With consumers getting comfortable traveling again, Expedia up 17% W/W after increasing spend over the last 7 weeks.

  • Adidas up 134% W/W, and VF Corp up 45% W/W as we've seen more retail brands increase spending in the last 2-3 weeks.

Privacy Changes May Already Be Impacting Programmatic

3f96fbbe-17a0-4e24-9bf3-81eeb1b86443.png

Benchmarks has lost 700M programmatic impressions since January. Where'd they go?

Ahead of next week's iOS 14.5 release from Apple, which includes the deployment of ATT (App Tracking Transparency), we’ve provided Mobile and Desktop CPMs and Impressions as a baseline. We’ll continue to monitor and share updates with you over the next few weeks.

a4bf456e-edae-4267-a290-ea89d671bf80.png
ee73555f-eaf5-4df9-a4ad-730bdbc6a0bb.png
  • Mobile impressions are down 13% from the start of the year, while Desktop impressions are down 11%.

  • Impact is across transaction types. Private impressions declining from 1% - 6% W/W since week 8, and Open impressions decreasing from 1% - 4% W/W.

  • Over the last 4 weeks, Mobile CPMs have continuously dropped 2% W/W.

  • Questions to consider:

    • Is this due to a change in the news cycle? 

    • Are marketers moving money out of the mobile web in preparation for a cookie-less world?

    • Is mobile inventory being perceived as less effective?

Is Everyone Getting GM Except You?

3f96fbbe-17a0-4e24-9bf3-81eeb1b86443.png

Is everyone getting General Motors spend but you?


Find out below with new insights from STAQ/Operative.

The chart below calls out advertisers who've increased spend 10%+ in the first week of Q2 vs the week prior. Also included is a new cut of data surrounding concentration of spend across publishers for both Open and Private.
 

3c91c500-86d7-41c2-bc26-b510cb4861d9.png

General Motors and Amazon spend on 44 publishers within Open Auction. Within Private, General Motors is the most indiscriminate with 34 publishers receiving spend. Alternatively, Liberty Mutual is very frugal with the fewest publishers receiving spend across both Open and Private. 

*Private includes Private Auction, Preferred Deals, and Programmatic Guaranteed. Benchmarking data runs across 50+ publishers*

Top Gainers End Q1 Strong

3f96fbbe-17a0-4e24-9bf3-81eeb1b86443.png

Steady Gainers Close Out Q1 

Included are the largest advertisers in the market who have shown steady weekly gains throughout Q1. Most of their highest spending weeks came at the end of the quarter, so keep an eye out for these advertisers in Q2.

7ffb0fc0-540e-49c9-a06d-c7c9e36c170d.png
  • Vaccine driving spend from US Government

  • Marriott & Expedia both up ~100% from the first half of Q1

  • Coca-Cola Black Cherry Vanilla pushing up spend 517% in the second half of Q1


*Week 14 crosses Q2. We typically see advertiser spend drop in the first week of a new quarter.

Advertisers Spending With Velocity

3f96fbbe-17a0-4e24-9bf3-81eeb1b86443.png

Advertisers Spending With Velocity

Over the last 2 weeks we’ve seen a large increase in spend of 50%+ from these 25 advertisers, some spending significantly for the first time in 2021. This list represents active spenders in the market with the most momentum heading into Q2. 

  • Nintendo and Sony both up >100% with their highest weeks of the year.

  • Home Depot up 164% and Lowe's up 133% as Home Improvement season starts to ramp up.

  • Making gains in the Finance category, PayPal up a massive 250% targeting B2B, and Nerdwallet up 76%.

8 Prospects That Increased PG By 100%

bd488021-85f4-4c05-8d63-ac742807e5fd (2).jpeg

8 Programmatic Guaranteed (PG) Prospects

Over the last 2 weeks, we've seen advertisers increase spend in PG deals, and CPM's have risen 8%. Highlighted here is a snapshot of the largest gainers in PG.

d10ea7fb-e410-4be9-b2f4-a8c0cf4c5d3f.png
  • Verizon up 111% in PG, and AT&T up 126% who just started spending in PG at the beginning of March.

  • New to PG and spending significantly for the first time in 2021, are Mastercard, up 214%, and L'Oreal, up a massive 1259% primarily marketing CeraVe.

  • Google, Diageo, Sony and Pepsi continue to spend in PG.

We'll continue to analyze PG trends and share the insights with you. As always, you can find all brand and transaction level data in your Benchmarking dashboard.

CPG Brands Favor Private

bd488021-85f4-4c05-8d63-ac742807e5fd (1).jpg

Brands Have a Transaction Type

We continue to see the largest growth so far this year from brands in Auto (up 12% YoY) and CPG (up 143% YoY). Many of these brands like SuaveFebreze, and Infiniti are favoring Private Auction & Preferred Deals, so we've included a subset of the top PMP advertisers in these categories below.

All brand and transaction level data is available in your Benchmarking dashboard.

Register for our Webinar March 11! Identify areas of opportunity for 2021 as we discuss programmatic insights from new Benchmarking data with Jon Morgenstern, SVP, Head of Investments at VaynerMedia, and Trish Reilly, Programmatic Lead at Mindshare.

95651cbd-b68e-45eb-87f4-04956dc5f6f3.png

Q2 Look Ahead Report

bd488021-85f4-4c05-8d63-ac742807e5fd (1).jpg

Get Ahead In Q2:

A Look At 2019 Top Q2 Advertisers

We agree with you. Q2 2020 would be a really poor comparison to Q2 2021 (let's not relive it), so we’ve pulled a list of the biggest spenders from Q2 2019. We hope you find this helpful in identifying opportunities in the coming quarter.

As a valued Benchmarking partner, if your data is available, you will also receive a more detailed custom report that includes your share of the top advertisers’ Q2 2019 spend. We hope this information helps you have a successful Q2 2021!

**The green bar represents the advertiser's Peak Revenue Week

This chart represents a typical mix of Q2 advertisers and a good indication of those likely to spend heavily this year. While we are only 6 weeks in, there are advertisers absent from this list that we've seen significantly increase spend in 2021, and will likely continue in Q2.

215e35fa-dc74-42e9-922e-a598db6487c9.png

At A Glance: 

  • In the last 4 weeks, Verizon and AT&T have shown significant weekly gains. Verizon is up 37 spots over Q2 '19 at #7 and AT&T rose to #14. However, T-Mobile is down 32 spots to #40.

  • Currently at #41, Samsung has been spending steadily over the last 3 weeks. If this trend continues, they could reach their Q2 '19 levels by next quarter.

  • Wayfair while still in the top 50, is down 29 spots to #37. After a Holiday spike, Nordstrom is down 81 spots so far this year, and not likely to return to their 2019 levels in Q2.

New To The Top 50 In The First 6 Weeks of 2021: 

  • Capital One #13

  • Discovery Inc #19

  • Albertsons #45

  • Dunkin' Brands #46

  • Bank Of America #48

  • Pepsi #49

Going Deeper With Brands

bd488021-85f4-4c05-8d63-ac742807e5fd.jpg

Get To Know Your Brands 

The Benchmarking data you’ve been waiting for is here! You and your teams can now identify and take action on Advertiser trends at the individual Brand level. 

Highlighted here is P&G and top advertisers in the Vehicle category to get you used to the new view. As we continue to analyze the dataset, we’ll explore trends around new brands entering the market and those displaying significant increases in spend.

All brand level data will be available in your Benchmarking dashboard this week under Industry or Parent Advertiser.

e583d236-7b71-4923-b87d-e1e822f2de5f.png
7620b304-4c84-4743-986d-f5f88ae8a364.png

Note About The Data: Limitations may exist where Brand data is passed via SSP as part of the Parent Advertiser. ie. SSP may report Tide as Procter & Gamble. Instances where we don't have visibility into a specific brand are labeled as "Unclassified Brand". We’re identifying solutions to fill this gap.

At A Glance: 

  • CPG is up 14% W/W driven by DoveSuave and Gillette. Interestingly, we've seen spend decline across P&Gs Laundry brands after starting the year strong.

  • Auto speeding back up with Ford up 42% W/W, and Nissan up 74% driven by InfinitiFCA up 51% led by the return of Fiat and Chrysler over the last week, and Dodge the last 2 weeks.

Travel Advertiser’s Regaining Their Status

bd488021-85f4-4c05-8d63-ac742807e5fd.jpg

Biggest Advertiser Movers

After Travel advertising spend stalled in 2020, there's encouraging momentum in the first 6 weeks of 2021. While still down YoY, Travel is up 6% W/W driven by Expedia and Southwest. The return of Airline, Hotel, and Booking site advertisers is a positive sign, and could be a strong indicator of a robust market around the corner. 

New BMX data! Next week we're releasing a new breakout of Advertiser Brands, providing you direction to take action at the individual brand level. The data will be available in your BMX dashboards. 

Y/Y trends of the 5 week avg Weeks 2-6 2021 vs 2020. W/W trends Week 6 vs Week 5 2021. Advertisers ranked by Revenue.

3e26e54b-76c6-41d9-b36a-832d4834994f.png

At A Glance: 

  • Expedia increasing weekly in 2021 with the largest W/W gains since last July. They're up 14% this week and expect them to continue spending. 

  • Airlines coming back with Southwest returning to their Jan/Feb 2020 spend levels over the last 2 weeks, and Delta up 88% W/W. May be a sign consumers are getting comfortable flying again.

  • Hotels are spending again with Marriott up 31%, Hilton up 80%, and Intercontinental up 12%.

Strongest CPM Growth In 3 Years

bd488021-85f4-4c05-8d63-ac742807e5fd.jpg

Fastest CPM Growth In 3 Years

Although CPMs in 2021 started down YoY, they displayed consistent daily gains throughout January, ending above 2020 levels. Additionally, the rate of CPM growth in January this year was much more significant than in 2020 or 2019.

While February CPMs have been consistent the last 2 years, the rapid increase in January CPMs observed this year, could result in February 2021 CPMs being up YoY. 

We continue to analyze YoY trends over the last 3 years, and are excited to review our insights along with additional advertiser data in our upcoming Webinar on March 11. More details to come in the next few weeks.

a6f67dab-41cf-494d-99c3-f69aa116a458.png

At A Glance: 

  • 2021 began with CPMs down 9% YoY. After steadily increasing D/D, January CPMs ended 4% above 2020.

  • Overall, CPMs in January 2021 increased 22%, a much more rapid improvement than 7% in Jan 2020, and 4% in Jan 2019. 

  • Over the month of February CPMs increased 10% in 2020, and 9% in 2019. Positive news if this trend continues or is exceeded in 2021.

Taxes Are A Bright Spot For Publishers

bd488021-85f4-4c05-8d63-ac742807e5fd.jpg

Biggest Advertiser Movers

Overall, Advertiser momentum continued to pick up in the 4th week of January. Of the Top 50 Advertisers, 35 are up W/W, Revenue is up 14%, and CPM's are up 13%. As expected some new advertisers entered the Top 50, and drove gains in the Finance, and Accounting categories as Tax Season ramps up. 

We're excited to have a new view of data looking at the last 36 months. We'll share insights on January CPM trends with you next week.

Y/Y trends of the 3 week average of Weeks 2-4 2021 vs 2020. W/W trends from Week 4 vs Week 3 2021. Spans January 3 - 23.

5741bab0-940b-4fb8-8e57-872ba2f1a408.png

At A Glance: 

  • Accounting up 145% W/W driven by Intuit (up 40%), a consistent Jan/Q1 spender, and TaxAct new to the Top 50 this year. At #67, H&R Block is off to a slower start than 2020, but should be in the Top 50 next week.

  • Finance is up 20% W/W. In addition to category leaders, we’re seeing gains from Capital One up 50%, AmEx, and BofA who is not usually a big Jan advertiser.

  • Walt Disney up 7 spots and 108% W/W. They started picking up spend early last week, likely promoting the McGregor fight on ESPN. 

Advertiser Momentum Picking Up

bd488021-85f4-4c05-8d63-ac742807e5fd.jpg

Biggest Advertiser Movers

Advertisers with the most momentum in the first few weeks of January have capitalized on WFH/social distancing trends and the usually lower CPMs this time of year. There were some familiar brands from Q4 in the Top 25 like Amazon and LendingTree. However more significant movement this January when compared to January 2020, which we originally referenced in this newsletter last month. 

We anticipate this momentum to continue, and the return of some absent spenders in the next few weeks - a good sign as we move through Q1.

Y/Y trends of the 2 week average of Weeks 2-3 2021 vs 2020. W/W trends from Week 3 vs Week 2 2021. Spans January 3 - 16.

3d057c48-69ac-43bb-8eab-8f5b31f72efa.png

At A Glance: 

  • Rock Holdings up 79% W/W, and hit the Top 5 for the first time ever. While typically a big January spender, they are up 172% YoY.

  • Auto growth in January with GM up 63% W/W, and VW up 143% W/W. Slow start to 2021 for Ford, dropping from #7 to #32 in the last 2 weeks.

  • Absent in Jan 2020, Eli Lilly up 67% W/W and in the Top 20. So far in 2021, 50% of their spend is PD/PA, 25% Open and 25% PG.

Left-hand numbers represent Advertiser rank in the dataset.

Top January Gainers

8975ca0f-acf2-4062-81cd-515c6f7c6967.png

At A Glance: 

  • Not a usual Jan/Q1 spender, Unilever hit the Top 50 and likely on the rise. They are up 331% W/W following almost no spend in Q4.

  • Restaurants up 70% W/W driven by fast food brands McDonalds up 62% W/W, and Roark (Jimmy Johns) up 285% W/W. The return of casual dining should be a sign of rising consumer confidence.