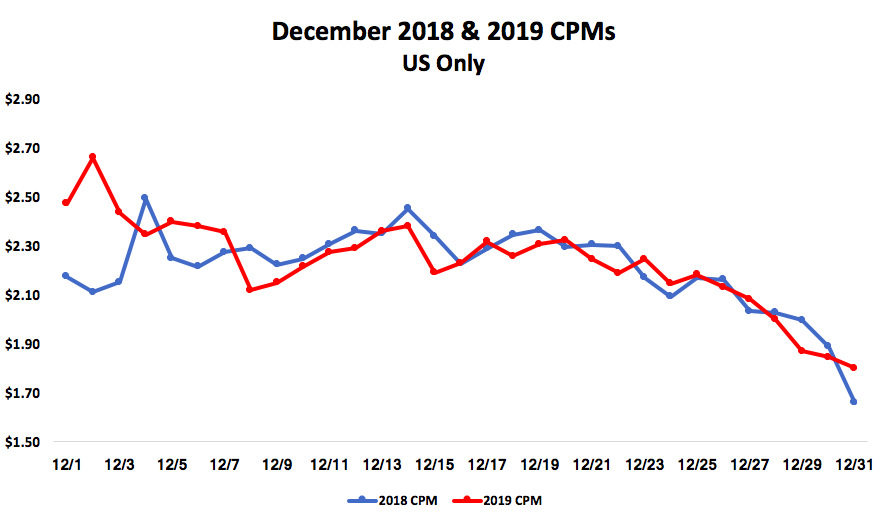
Christmas In July For Desktop CPMs

3f96fbbe-17a0-4e24-9bf3-81eeb1b86443 (1).png

Desktop CPMs Rising Like It's Christmas 2019, While Impressions Hit A 3-Year Low

As the US opens back up and consumers spent more time on mobile devices, Desktop inventory has dropped 25% since Q1, while CPMs have grown exponentially.

Since April, Desktop CPMs have grown 3% each week, reaching levels we haven't seen since Holiday 2019.

We'll see if this trend continues into the rest of the summer and Q3.

bdab4cc0-f48b-a608-90e0-c2e88f7bc464.png

At A Glance:

  • The Open market is behaving as expected as apparent Desktop scarcity drives rising CPMs, up 17% from Q1 and reaching their highest levels since Q4 2019.

  • Pro Tip: Despite Google delaying their Cookie deprecation, its important to start looking deeper into device trends at the browser level in order to identify opportunities to improve your CPMs. We'll keep you updated with our analysis.

CPM Growth A Good Sign For Q3

3f96fbbe-17a0-4e24-9bf3-81eeb1b86443 (1).png

Chrome Active CPMs Growing Fast

Regardless of ongoing industry changes, Publisher CPMs have continued to grow in Q2. Even with adoption of iOS 14.5+ increasing weekly, Q2 CPMs are 10% higher than Q2 2019 levels and continue to grow. This market resilience is a good sign for a strong end of Quarter and positive Q3.

596c2554-793d-121a-ef84-b512ab8af1f9.png
5a38cae1-88cd-7db7-5c38-89afa6995153.png

*The above chart represents the average CPM and Share from weeks 2-24.

At A Glance:

  • Active CPMs are 296% higher than Restricted on Chrome, and 120% higher on Safari, however the Restricted share on Safari makes up 65% and continues to grow W/W.

CPMs Rise Amid More Ad Spend

3f96fbbe-17a0-4e24-9bf3-81eeb1b86443 (1).png

CPMs Rise Amid More Ad Spend

Whatever it is, the way you tell your story online can make all the difference.

Whatever it is, the way you tell your story online can make all the difference.

CPMs increased throughout April, ending 9% above 2019 levels. Perhaps a driver is the flock of smaller advertisers in Travel, Beverages, etc. continuing to spend more, and existing advertisers like in Auto, whose spending remains strong. Furthermore, early indications suggest that iOS 14.5 has not disrupted this positive trend yet, and we are keeping a close eye as 14.5 gradually rolls out across the ecosystem.

  • CPMs showed positive momentum in March, ending 3% above 2019 levels.

  • So far in Q2, CPMs are 28% over Q1 levels, while in 2019 Q2 was 19% higher than Q1 over the same time period.

  • In 2019, Q2 began with a 16% CPM drop, while Q2 2021 only displayed a 5% decline and continues to show positive W/W increases.

Privacy Changes May Already Be Impacting Programmatic

3f96fbbe-17a0-4e24-9bf3-81eeb1b86443.png

Benchmarks has lost 700M programmatic impressions since January. Where'd they go?

Ahead of next week's iOS 14.5 release from Apple, which includes the deployment of ATT (App Tracking Transparency), we’ve provided Mobile and Desktop CPMs and Impressions as a baseline. We’ll continue to monitor and share updates with you over the next few weeks.

a4bf456e-edae-4267-a290-ea89d671bf80.png
ee73555f-eaf5-4df9-a4ad-730bdbc6a0bb.png
  • Mobile impressions are down 13% from the start of the year, while Desktop impressions are down 11%.

  • Impact is across transaction types. Private impressions declining from 1% - 6% W/W since week 8, and Open impressions decreasing from 1% - 4% W/W.

  • Over the last 4 weeks, Mobile CPMs have continuously dropped 2% W/W.

  • Questions to consider:

    • Is this due to a change in the news cycle? 

    • Are marketers moving money out of the mobile web in preparation for a cookie-less world?

    • Is mobile inventory being perceived as less effective?

We Have A New View On Advertiser Spend

bmx.png

It's a break out week for Transaction Types. We are excited to share new cuts of data that provide you and your teams a more granular understanding of Advertiser spending and CPMs in the Private and Open Markets. 

We are sharing Q4 data to familiarize you with the data and act as a baseline. Included are the Top 20 Advertisers in Q4 2020. We observed their different programmatic strategies based on spend distribution across Transaction Types (Open, PD/PA, and PG). As the variability between Private and Open from Quarter to Quarter becomes clear, we'll share those insights with you.

You can access this data and a more detailed breakout on all advertisers in your Benchmarking Dashboard. Reach out to your Account Manager for any questions or a demo.

Advertiser Rev Share By Transaction Type

2c0d1134-338e-43b9-b969-2b0ccb915f49.png

At A Glance: 

  • 9 of the Top 20 Q4 advertisers had 70%+ of their revenue share in the Open Market vs Private Channels. Most reliant on Open was LendingTree at 96%, and Best Buy at 92%.

  • Retailers Target and Wal-Mart both spent the most via PD/PA. However in Mobile, AT&T utilized PD/PA the most, while Verizon favored Open, followed by PG.

Advertiser CPMs By Transaction Type

265b10d4-fcc6-468e-bdb3-78b9001988c3.png

At A Glance: 

  • Wal-Mart and State Farm CPM's in PD/PA were <$1 higher than Open

  • However, HP and Ford's PD/PA CPM's were ~$9 higher than Open

Good CPM News To Start The New Year

bmx.png

The New Year's CPM Story

It looks like CPMs were just as excited for the New Year as we all were. While we observed the expected New Year CPM drop, the decline on January 1, 2021 wasn’t as great as last year’s. Overall, while CPMs were down through the first few days of January, they began to increase January 4th, over a week earlier than last year. While we only have 5 days worth of data, if this trend continues, healthy CPMs may return sooner than they did in 2020.

January CPMs On The Rise

jan cpms.png

At A Glance: 

  • CPMs saw a 17% D/D decline on January 1, 2021 vs the 21% drop in 2020. 

  • After increasing over the last 2 days, January 5th CPMs were up 7% YoY. It had taken until the 2nd week in January 2020 to hit that CPM. A good sign if this trend continues.

Coming Up:

We are excited to share a new cut of data in the next couple of weeks breaking out the Top 50 Advertisers spending via PG, vs Open Market and Private Auction. This will help enable you and your teams to identify:

  • Which advertisers/categories are spending more in PG/PD than OM?

  • Which advertisers aren’t in the OM or abandoned OM to focus on PG/PD?

  • Which advertisers don’t do PG?

  • What CPMs are advertisers paying per transaction type?

You will be able to see the breakout of these transaction types in your Advertiser Benchmarking Dashboards by the end of this week. Reach out to your Account Managers with any questions.

When The Ball Drops, Hopefully CPMs Don't

staq insights bmx.png

New Year, New CPMs

As we head into the last weeks of 2020 (see ya!), we reflect… on CPMs of course. 

2020's extended holiday season saw lessened event driven spikes for Black Friday and Cyber Monday. As marketers remain focused on e-commerce, Cyber Monday generated the highest CPM day in 2020. Our hope is that the December-January drop in CPMs will not be as great as in previous years, and advertisers will take advantage of lower CPMs and bolster the market quickly. 


We’ll be keeping an eye on this, in addition to other Holiday trends, and send out an update the week of January 4th once we know how the first week of 2021 looked.


As we head into the New Year, we’ve included a list of the Top 50 advertisers in January 2020. Opportunistic spenders like H&R Block, Bayer, Salesforce, GSK and Office Depot capitalized on the lower CPMs, and significantly increased their spend YoY. You can see the full list below.


The December - January CPM Story

dec jan story.png

At A Glance: 

  • At the start of 2020, we saw a continuous drop over the first week in January, hitting a low 1/6 before starting to steadily increase.

  • CPMs dropped 32% from the last week in December 2019 to the first week in January 2020. The single day drop from 12/31/19 to 1/1/20 was 21% D/D.

  • We saw the return of healthy CPMs as we entered the 3rd week in January 2020.

Below is a view of the top 50 advertisers, based on spend in January 2020.
-The left column displays the weekly trends from Weeks 2-4. 
-The middle column compares Y/Y trends of the average of Weeks 2-4 2020 vs 2019.
-The right column displays the advertiser's overall 2020 rank. For Example: Who spent heavily in January 2020, and did or did not spend throughout the rest of the year.


Top 50 Advertisers In January 2020

top 50 jan.png

Publishers Get Higher CPMs For The Holidays

bmx.png

Aside from retail continuing to build as we head into the Holiday season, Week 46 showed no other significant advertiser movement. Fortunately, we are seeing positive trends impacting Q4. PG & PD are increasing, and Desktop, Video & Display CPMs are making a comeback, all trends that should continue and contribute to a successful rest of the year.

The Top 50 Advertiser report for this week can be found here.

As a valued Benchmarking partner, if your data is available, we will be sending out a custom report in the next week that provides a look at your top advertisers in Q1 2020 as a way to offer actionable direction to help you plan for next year.

What Happens In Private Moves To PG & PD

pgpd.png
  • Private Auction Rev share has steadily declined since Q3, in favor of PG which is up 9% W/W, and PD which is up 22% and surpassed Private Auction this week. 

Desktop CPMs Making A Comeback

desktop cpms.png
  • After a strong year for Mobile, Desktop CPMs showing significant increases and surpassing Mobile in Week 45. With many consumers still choosing Desktop as their screen of choice for online shopping, we expect this trend to continue through the holidays.

Video & Display On The Nice List 

videodisplay.jpg
  • Video CPMs on the rise in Q4, surpassing 2019 levels. Aside from a Week 45 spike likely related to the election, CPMs should continue to increase.

  • While Display CPMs have been down all year, they've finally surpassed 2019 levels in Week 44. We expect the holidays to further boost CPMs over the next few weeks.

STAQ's Guide To A Monster Q4

bd488021-85f4-4c05-8d63-ac742807e5fd.jpg

Get Ahead In Q4:

A Look At 2019 Top Q4 Advertisers

As we quickly approach the start of Q4 (almost through 2020!) We are reviewing the top advertisers from Q4 2019 with the goal of uncovering opportunities for the rest of this year. All year, advertisers have valued flexible planning/budgets, and hope this offers a helpful tool as they continue to implement spending in Q4.  We hope this information offers actionable direction that helps you have a successful Q4 2020!

The chart below is last year’s Top 50 from Q4. It represents a typical mix of Q4 advertisers and a good indication of those likely to spend heavily this year. Only 11 advertisers peaked in October with the majority displaying their highest weeks in November and December. Additionally, there are advertisers not represented below that we’ve seen spend significantly all 2020, and will likely continue in Q4. 

8dbecc45-b96d-493f-bb79-fbfa7f9e2297.png

**The green bar represents the advertiser's Peak Revenue Week

Advertisers New To The Top 50 In 2020: 

  • Unilever: #72 to #22

  • LendingTree: #57 to #5

  • Liberty Mutual: #83 to #37

  • Eli Lilly: #67 to #25

  • AllState: #62 to #26

New 2020 Opportunities: 

  • Last year, we observed a revenue peak in weeks 46 - 51 which included Black Friday and Cyber Monday. With both holidays being more e-commerce focused in 2020, we may see retail dependent advertisers increase their programmatic spend. 

  • Biden and PACs already started to increase spend over the last 2 weeks and we expect Political advertising to continue to trend up until the election. Possibly helping boost Q4 CPMs for News Pubs running up to Nov 3rd.

  • Apple typically spends around their big product releases. While they've begun promoting the Watch, the new iPhone release has moved to October this year. 

  • Sony & Microsoft have major releases for the highly anticipated PS5 and XBOX in November, Activision and other game developers have new games launching for the platforms.

  • Moderna, Pfizer, Novavax, AstraZeneca all have the potential to have a vaccine ready for distribution in Q4 2020.

How To Read The Chart:

·   The advertiser list includes the Top 50 spenders (from our dataset) in Q4 2019

·   The 2019 weekly trend lines show spend fluctuations from Oct-Dec with the green line representing that advertiser’s peak revenue week, which is also called out next to it.

·   The last column represents where those advertiser’s rank in 2020 through week 37

Newsletter 8.18

bmx.png

2020 & 2019 Weekly CPMs

This week we explore weekly and YoY CPM trends. The most notable takeaway is that despite being down from 2019 levels, 2020 CPMs are following the EXACT same trends as last year. If this continues, we should see a healthy CPM increase during Q4. And if our publishers are right, possibly hitting 2019 levels with advertisers looking to make up spend and drive sales.

mm.png
  • CPMs started the year in line and slightly up over 2019 levels before precipitously dropping around Week 11 due to COVID. 

  • Week 16 CPMs were down 41% YoY.

  • CPMs started climbing in Week 23 and have been in lock-step with 2019 trends over the last 11 weeks. 

  • CPMs in the last 11 weeks have been returning to Q1 2020 levels, but are still 20% below last year.

Device Type: Desktop & Mobile

mm1.png
  • Desktop and Mobile CPMs began converging around Week 17 with Mobile CPMs only 5% below Desktop by week 20. The CPM gap widened to 13% by Week 33.

  • Mobile CPMs have displayed more resilience than Desktop in 2020, with Mobile CPMs surpassing pre-COVID levels by week 25 while Desktop continues to struggle to meet pre-COVID CPMs.

Creative Size CPMs YoY

mm2.png
  • 2020 Video CPMs are 40% below 2019 CPMs dropping ~$3.30 in 2020. Video CPMs are unlikely to recover to 2019 levels.

  • 300x250 is 22% below 2019, but has been gradually increasing in the last 5 weeks.

Advertiser Data: Biggest Movers

You can view this week’s Top 50 Advertisers Gainers and Decliners chart here.

The right column compares Y/Y trends of the 4 week average of Weeks 30-33 2020 vs 2019. The left column compares W/W trends from Week 33 vs Week 32.

At A Glance: 

  • Not highlighted in today’s table, but important to know CPMs have been making a comeback with some unusual summer peaks.

  • Unilever is having a big summer with high levels of spend, up 19% this week, while P&G is dark or avoiding programmatic.

  • Seeing activity in the Finance category, outside of Lending Tree, with steady increases from Wells Fargo and Fidelity Investments, both hitting new 2020 highs. American Express has finally made a reappearance returning to mid-March levels this past week. 

Are April CPMs Getting Cabin Fever?

Overall CPMs Up Since Start of April

35.png
  • Following drastic CPM drops in March and early April, we have seen less pronounced fluctuations throughout the month.

  • CPMs increased April 18-19 following weekend trends

  • A good sign: CPMs have increased 7% Monday (April 20) over prior Monday.

AdX CPMs Remain Stable as Facebook CPMs Rise

36.png
  • Facebook CPMs continue to impress following a drop at the end of March. 

  • TripleLift CPMs have continued to increase since April 14. 

  • AdX and AppNexus CPMs have remained stable, while most others experienced a decline in early April.

Games/Tech Remain Strong

37.png
  • Games/Tech CPMs have been holding steady.

  • Both News and Lifestyle/Entertainment CPMs have been stable month-to-date.

  • Sports CPMs experienced an increase over the weekend of April 18-19 but have remained stable throughout April.

A Note About the Data: One day does not make a trend. We have learned that we need to see 3-5 days to see true movements on the data, like the April 11 CPM increase and Facebook's CPM drop on April 17.

Don’t Forget to register for our INSIGHTS by STAQ presentation next Friday, where we will further explore CPM trends along with additional relevant analysis across our dataset.

Click here to access your Benchmarking portal or contact your STAQ Account manager to find custom insights you can leverage

*The data in this email compares programmatic industry performance, running through STAQ systems for April 2020. This view excludes a publisher and a partner*

Big Little Wins

A Tiny Bit of Good News: Could this be a Trend?

31.png
  • Looking at the first 21 days of March, we observed revenue drop by 6% and CPMs drop by 19%, while impressions increased by 16% YoY.

  • We typically see CPMs pop towards the end of Q1, but have observed 2020 CPMs consistently trending down since March 9th. 

    • Good news is that CPMs appear to have plateaued following March 19th. We’re not sure how long this trend will continue, as we typically observe CPMs drop at the start of April.

    • After consistent CPM downturn, AdX CPMs along with Amazon, Rubicon, AppNexus, and Index Exchange have also flattened following March 19th. AdX’s plateau may be attributed to the rumors we’ve heard that Google is absorbing AdX fees to support publishers. Can anyone help validate?

Coming this Friday

We’ve previously only touched upon video specific trends. On Friday, we will be releasing a comprehensive dive into February and March video trends, available only to Benchmarking Clients.

*The data in this email compares programmatic industry performance, running through STAQ systems for March 2019, April 2019, and March 2020.*

Wash Your Hands Before Reading This

Coronavirus Continues to Impact Ad Spend

Given the overwhelming response to last week’s newsletter on Coronavirus’ impact on ad spend, we’ve continued our industry analysis. Expanding on verticals, we’ve focused on select advertisers as well. Our findings compare the first week of March 2020 to that of February 2020. 

Today’s data is through March 9th. As major announcements on March 11th (cancelling most sporting events, Travel Ban, etc) mark a turning point in the public response to the virus, we will be tracking further impact on the market. For those interested, we are offering a deeper dive via a webinar next Friday at 2pm EST. Please sign up via this link to reserve your spot. This is only available to BMX customers.


March 2020 vs. February 2020

30.png
  • Finance decreased 36%, dropping from 15th to 24th. 

    • Capital One decreased 30% and E-Trade decreased 32%. This may be attributed to recent market volatility.

  • Credit & Lending decreased 30%, falling from 10th to 14th.

    • Rock Holdings (Quicken Loans and Lower My Bills) decreased 23%.

  • Food & Grocery dropped from 27th to 32nd, decreasing 20%. 

    • The Kroger Co. decreased 23%. We anticipate this vertical to increase in the next few weeks. 

  • Consumer Goods grew 23% and is now 21st up from 26th.

    • The largest mover was Unilever which increased 335%. We expect this vertical to grow as well.

  • Interestingly, Travel increased 26%, growing from 14 to 11.

    • Expedia increased 24%. We suspect this vertical will decrease moving forward. 

  • Government increased 169%, from 33rd to 10th.

    • U.S. Government was the biggest mover, growing 150%.

* The data in this email compares programmatic advertiser industry performance, running through STAQ systems for March 2019, February 2020, and March 2020.

Coronavirus Hits Ad Spend

Coronavirus Impacts Ad Verticals

29.png

The Coronavirus has made an impact on almost everything in our daily lives from the stock market to our advertiser benchmarks. We started to see revenue rise in health related industry verticals in February while travel related verticals have decreased. 

Comparing top verticals from February 2020 to February 2019, we’ve observed:

  • Pharmaceuticals & Biotech revenue increased a staggering 175% YoY and is now the 2nd highest revenue vertical in 2020 up from 11th in 2019.

  • Pharmacy rose from 35th to 21st in 2020, increasing revenue 171%. 

  • Travel revenue decreased 29%, falling from 17th to 33rd in 2020.

Other notable vertical movers:

  • Shopping decreased by 46%, falling from 23rd to 37th.

  • Consumer Electronics decreased by 52%, falling from 6th to 25th.


* The data in this email compares programmatic advertiser industry performance, running through STAQ systems for February 2019 and February 2020.


Racing for Political Spend...Let's Caucus

Top Political Ad Spend

Note on the Data: This data compares programmatic advertising spend running through STAQ systems from September 2019 to February 2020 across 10+ partners. Of the advertisers in our Politics & Advocacy vertical, the analysis below is focused on the top 2 programmatic spenders: Tom Steyer and Mike Bloomberg.
 

Daily 2020 Political Spend
 

27.png

  • We observed that 2-5 days leading up to a debate or the Iowa Caucus, Bloomberg picked up spend while Steyer remained consistent.

    • Leading up to the Iowa Caucus, on February 1, Bloomberg drastically increased spend overnight by almost 467%.

  • To put this in perspective: In 2020, across the publishers and partners where we’ve seen spend, candidates Steyer and Bloomberg are amongst the top 15 advertisers, and together have spent more than AT&T, Procter & Gamble, Apple, and Capital One combined. 

Monthly Spend by Select Candidates

28.png

From September 2019 to January 2020, we observed a sharp increase in spend in our Politics & Advocacy vertical as the election season heated up.

  • The largest MoM growth occurred from December 2019 to January 2020.

    • Steyer increased spend by 412% and Bloomberg by 782%.

  • Steyer, one of the highest spenders, comprised 59% of the Politics & Advocacy vertical spend.

    • Over 5 months, he outspent Microsoft and Progressive Insurance. 

  • Since announcing his bid in late November, Bloomberg quickly became a top spender, accounting for 18% of spend in Politics & Advocacy.


Dates to Note:

  • Bloomberg announces bid for presidency - November 24

  • Debates - January 14, February 7, February 19, February 25

  • Iowa Caucus - February 3

  • Super Tuesday - March 3

Want to know which DSPs see the most political spend? How about which candidate is the most promiscuous in their DSP choices? Contact your STAQ Account Manager to find out!

Dread January CPMs? Look what we found...

A Look at January CPMs

25.png
  • We observed CPM variability at the start of 2020. However, we predict that CPMs will level off towards the end of January and begin to steadily climb throughout the quarter resulting in YoY gains. Check out your STAQ Benchmarking dashboard here to see your CPM trend.

  • A positive sign for the quarter, CPMs surpassed January 2019's high earlier in 2020.

    • January 2019 hit $1.43 on the 26th, while January 2020 hit $1.54 on the 18th delivering an 8% increase YoY. We observed a CPM spike on the 18th across multiple partners and publishers.

  • Of our benchmarking partners, Facebook and Pubmatic reached or exceeded their 2019 CPM average early in January.

    • Pubmatic began the year with CPMs 7% higher than their 2019 average, while Facebook registered a 2% increase over their average in the first two weeks.

    • Interestingly, Facebook's revenue share was at 7% in December 2019, while their revenue share for this month is at 11% (similar to January 2019). If 2019 is any predictor, Facebook likely won’t maintain this level of contribution as the year progresses.


Brief Recap of Q1 2019 vs Q1 2018

  • Following a slow start to 2019, Q1 2019 ultimately delivered a 4% revenue increase and a 15% impressions increase YoY, while CPMs decreased 10%.

  • The number of partners producing over $100K per quarter grew from 31 to 37 YoY.

  • Mobile rose to 46% of revenue share, while Desktop lost declined. 

Question of the Week?

Who were the top 3 Advertisers of Q1 2019? To find out, click here to access your STAQ Advertiser dashboard.

If you have any trouble accessing or navigating your dashboard, please contact your Account Manager.

Week At A Glance

*  The data in this email compares programmatic industry performance across US only running through STAQ systems for January 2019 - January 2020 and excludes 2 outlier publishers

26.png

New Year, New CPM’s and a Wrap on Q4

The New Year’s Day CPM Trend
 

Over the past few years we’ve observed the lowest CPMs of each year on January 1st, which we’ve listed below.

23.png


Following a January 1, 2019 low of $1.18, we observed an immediate CPM growth through Q1. CPMs remained stable throughout the year at an average of $1.80 until Q4. With January 1, 2020 CPMs 12% higher than last year, we see this as an encouraging start to 2020.


Q4 2019 vs. Q4 2018

24.png
  • As anticipated, we saw a precipitous CPM drop after Christmas in 2019. However, this decrease was not as dramatic as 2018. New Year's Eve 2018 CPM dropped to $1.66 while 2019 remained around $1.80.

  • We’ve been keeping an eye on how the 6 less business days between Thanksgiving and Christmas would impact Q4, here’s what we’ve found:

    • October saw a 12% revenue increase YoY, an 8% impressions increase, and a 3% CPM increase. This may be attributed to an overall earlier start to the holiday shopping season. 

    • November experienced a 3% revenue decrease, and a 1% decrease in impressions and CPMs, while December registered a 5% revenue and impressions decrease, and a 1% increase in CPMs. 

    • Overall, Q4 2019 delivered flat revenue, impressions, and CPMS YoY.


* The data in this email compares programmatic industry performance across US only running through STAQ systems for October 2018 - January 2020.

All I Want for Christmas are STAQ's Advertiser Benchmarks

The Impact of Disney & Apple in 2019

20.png
  • Pharma displayed consistent growth in 2019, with a November increase of 54% over its yearly average.

  • Entertainment experienced a November peak that was 152% over its yearly average, likely driven by the release of Disney+.

  • Mobile & Wireless delivered an 80% November increase over its average. Revenue remained steady until September, which may be attributed to the release of the new Android and iPhone.


Opportunities in Private

21.png
  • From our dataset, we’ve observed that Target conducts the majority of its deals in Private Auction at much higher CPMs than Open Auction.

  • AT&T conducts 47% of its deals in Private Auction, but only at slightly higher CPMs.

  • Groupe Renault runs 32% of its deals in Private Auction at significantly higher CPMs.

  • Interestingly, one of the largest global advertisers conducts 24% of its deals in Private Auction but has higher CPMs in Open Auction. To find out more, contact your STAQ representative.

Growing DSPs

22.png
  • Verizon Media is experiencing significant growth in 2019, with November net volume ($) 50% over its average. 

  • The Trade Desk has consistently grown since July with November net volume ($) at 44% over its average. This is likely due to The Trade Desk’s general evolution of product this year.


If you haven’t accessed your advertiser benchmarking dashboard, please reach out to your STAQ representative to find custom insights you can leverage.  


Note on the data:
The data in this email includes ~ 40 publishers, 13 partners (SSPs), and 200+ top advertisers across 150+ DSPs running in STAQ systems from January 2019 to November 2019. The included partners have made significant investments in providing a wider dataset and higher levels of transparency. This data does not include endemic publishers who may skew the data.

Holiday Recap: 2019's Top Advertising Day Is...

Takeaways from This Holiday Season

18.png

Similar to last year, Cyber Monday (12/2) was the highest revenue day of 2019. Surprisingly, the day before Cyber Monday (12/1) was the second highest revenue day, and Black Friday the third.

  • Cyber Monday experienced 15% higher revenue than Black Friday, but 5% lower CPMs.

  • Comparing 2019’s Black Friday and Cyber Monday to 2018, we observed:

    • Black Friday 2019 registered a 4% revenue decrease over 2018 and a 2% CPM increase.

    • Cyber Monday 2019 saw a modest revenue decrease of 1% over 2018 with a 3% drop in CPMs.

    • However, Mobile is having a positive holiday season. Mobile experienced a 16% growth in revenue and impressions on Cyber Monday, and a 14% revenue increase coupled with a 21% impression increase on Black Friday.


Up Next: A Quarter to Date Deep Dive

  • So far, Q4 2019 delivered 3% revenue growth, 2% CPM growth, and flat impressions over 2018. However, given the late Thanksgiving, will this modest growth be sufficient for a positive Q4?

  • December 2018 saw a 5% revenue decrease driven by the typical post- Christmas decline.

Week At A Glance

19.png