We Have A New View On Advertiser Spend

bmx.png

It's a break out week for Transaction Types. We are excited to share new cuts of data that provide you and your teams a more granular understanding of Advertiser spending and CPMs in the Private and Open Markets. 

We are sharing Q4 data to familiarize you with the data and act as a baseline. Included are the Top 20 Advertisers in Q4 2020. We observed their different programmatic strategies based on spend distribution across Transaction Types (Open, PD/PA, and PG). As the variability between Private and Open from Quarter to Quarter becomes clear, we'll share those insights with you.

You can access this data and a more detailed breakout on all advertisers in your Benchmarking Dashboard. Reach out to your Account Manager for any questions or a demo.

Advertiser Rev Share By Transaction Type

2c0d1134-338e-43b9-b969-2b0ccb915f49.png

At A Glance: 

  • 9 of the Top 20 Q4 advertisers had 70%+ of their revenue share in the Open Market vs Private Channels. Most reliant on Open was LendingTree at 96%, and Best Buy at 92%.

  • Retailers Target and Wal-Mart both spent the most via PD/PA. However in Mobile, AT&T utilized PD/PA the most, while Verizon favored Open, followed by PG.

Advertiser CPMs By Transaction Type

265b10d4-fcc6-468e-bdb3-78b9001988c3.png

At A Glance: 

  • Wal-Mart and State Farm CPM's in PD/PA were <$1 higher than Open

  • However, HP and Ford's PD/PA CPM's were ~$9 higher than Open

Good CPM News To Start The New Year

bmx.png

The New Year's CPM Story

It looks like CPMs were just as excited for the New Year as we all were. While we observed the expected New Year CPM drop, the decline on January 1, 2021 wasn’t as great as last year’s. Overall, while CPMs were down through the first few days of January, they began to increase January 4th, over a week earlier than last year. While we only have 5 days worth of data, if this trend continues, healthy CPMs may return sooner than they did in 2020.

January CPMs On The Rise

jan cpms.png

At A Glance: 

  • CPMs saw a 17% D/D decline on January 1, 2021 vs the 21% drop in 2020. 

  • After increasing over the last 2 days, January 5th CPMs were up 7% YoY. It had taken until the 2nd week in January 2020 to hit that CPM. A good sign if this trend continues.

Coming Up:

We are excited to share a new cut of data in the next couple of weeks breaking out the Top 50 Advertisers spending via PG, vs Open Market and Private Auction. This will help enable you and your teams to identify:

  • Which advertisers/categories are spending more in PG/PD than OM?

  • Which advertisers aren’t in the OM or abandoned OM to focus on PG/PD?

  • Which advertisers don’t do PG?

  • What CPMs are advertisers paying per transaction type?

You will be able to see the breakout of these transaction types in your Advertiser Benchmarking Dashboards by the end of this week. Reach out to your Account Managers with any questions.

When The Ball Drops, Hopefully CPMs Don't

staq insights bmx.png

New Year, New CPMs

As we head into the last weeks of 2020 (see ya!), we reflect… on CPMs of course. 

2020's extended holiday season saw lessened event driven spikes for Black Friday and Cyber Monday. As marketers remain focused on e-commerce, Cyber Monday generated the highest CPM day in 2020. Our hope is that the December-January drop in CPMs will not be as great as in previous years, and advertisers will take advantage of lower CPMs and bolster the market quickly. 


We’ll be keeping an eye on this, in addition to other Holiday trends, and send out an update the week of January 4th once we know how the first week of 2021 looked.


As we head into the New Year, we’ve included a list of the Top 50 advertisers in January 2020. Opportunistic spenders like H&R Block, Bayer, Salesforce, GSK and Office Depot capitalized on the lower CPMs, and significantly increased their spend YoY. You can see the full list below.


The December - January CPM Story

dec jan story.png

At A Glance: 

  • At the start of 2020, we saw a continuous drop over the first week in January, hitting a low 1/6 before starting to steadily increase.

  • CPMs dropped 32% from the last week in December 2019 to the first week in January 2020. The single day drop from 12/31/19 to 1/1/20 was 21% D/D.

  • We saw the return of healthy CPMs as we entered the 3rd week in January 2020.

Below is a view of the top 50 advertisers, based on spend in January 2020.
-The left column displays the weekly trends from Weeks 2-4. 
-The middle column compares Y/Y trends of the average of Weeks 2-4 2020 vs 2019.
-The right column displays the advertiser's overall 2020 rank. For Example: Who spent heavily in January 2020, and did or did not spend throughout the rest of the year.


Top 50 Advertisers In January 2020

top 50 jan.png

Publishers Get Higher CPMs For The Holidays

bmx.png

Aside from retail continuing to build as we head into the Holiday season, Week 46 showed no other significant advertiser movement. Fortunately, we are seeing positive trends impacting Q4. PG & PD are increasing, and Desktop, Video & Display CPMs are making a comeback, all trends that should continue and contribute to a successful rest of the year.

The Top 50 Advertiser report for this week can be found here.

As a valued Benchmarking partner, if your data is available, we will be sending out a custom report in the next week that provides a look at your top advertisers in Q1 2020 as a way to offer actionable direction to help you plan for next year.

What Happens In Private Moves To PG & PD

pgpd.png
  • Private Auction Rev share has steadily declined since Q3, in favor of PG which is up 9% W/W, and PD which is up 22% and surpassed Private Auction this week. 

Desktop CPMs Making A Comeback

desktop cpms.png
  • After a strong year for Mobile, Desktop CPMs showing significant increases and surpassing Mobile in Week 45. With many consumers still choosing Desktop as their screen of choice for online shopping, we expect this trend to continue through the holidays.

Video & Display On The Nice List 

videodisplay.jpg
  • Video CPMs on the rise in Q4, surpassing 2019 levels. Aside from a Week 45 spike likely related to the election, CPMs should continue to increase.

  • While Display CPMs have been down all year, they've finally surpassed 2019 levels in Week 44. We expect the holidays to further boost CPMs over the next few weeks.

Advertisers Come Home For The Holidays

bd488021-85f4-4c05-8d63-ac742807e5fd.jpg

After some advertisers took a breath for the election, Week 45 saw the highest revenue of the year, up 23% W/W. Some of the most significant gains came from advertisers outside of the Top 50 (and some we called out in this newsletter as ones to watch in Q4). With holiday campaigns already in full force, retail and luxury brands started to make gains we haven't seen since pre-covid. 

It will be interesting to see how the potential for a vaccine in Q4, will impact categories like travel, food, airlines etc. and we’ll have more analysis on this in the next few weeks. We’re seeing early signs of a comeback, but will these advertisers who are usually heavy spenders in Q4, finally show up in a significant way? Or, after being on the sidelines for so long, hold off until after Xmas/Q1? Regardless, we are excited for the return of more advertisers into the mix, and what’s sure to help drive the Open Market.

222.png

At A Glance: 

  • All eyes on Pharma. Even before the big announcement, Pfizer had a big W/W increase, up 62%. Bayer, absent since the end of May, had a huge week, up over 500% driven by OTC Cold & Flu meds.

  • ‘Tis the season for Retail. Macy’s, L Brands, and Kohl’s showed significant W/W gains. We expect this category, especially brands with an e-comm strategy like Wayfair (up 62% W/W) to continue spending until Xmas. 

  • Save or Spend. Finance category up 29% W/W with its highest week of the year. Citigroup and BofA hitting high weeks, and AmEx up 27% and likely to break the Top 50 before EOY.

  • Zoom envy. For the first time since March, Luxury advertisers are spending. After slowly increasing over the last 8 weeks, Tiffany up 26% W/W. LVMH, Richemont, and Kering (Gucci, YSL) also saw gains this week. 

Below is a view of the top 50 advertisers, based on spend. The right column compares Y/Y trends of the 4 week average of Weeks 42-45 2020 vs 2019. The left column compares W/W trends from Week 45 vs Week 44.

The Grand Total represents the entire Advertiser dataset.

1110.png

History Trumps The Election

bd488021-85f4-4c05-8d63-ac742807e5fd.jpg

Advertiser Data: Biggest Movers

Are advertisers pulling spend leading up to the election? With a big pause in spending over this past weekend, and 24 of the Top 50 advertisers down W/W, it sure looks like it from the data. 

We took an unscientific survey of publishers, marketers, and agencies, and heard a resounding “NO.” Marketers are continuing their plans, but they stand ready to pull back if needed. So while it could be the election, we also had Halloween and the end/start of a month, which may have had an impact. 

Interestingly in 2019, we saw a similar drop in revenue at the start of November before steadily increasing over the following week. While 2020 has been an anomaly, we do expect spending to pick up in the next week, or once election anxiety subsides.

So while the election may have had some impact so far, the real story will show in this week’s data. 

2019 nov.png

At A Glance: 

  • Autos on the move. Despite being down W/W, Ford moved up 5 spots over the last 2 weeks to #7. GM & VW move into the Top 20 both with their highest weeks of the year. They could break the Top 15 in the next few weeks.

  • AT&T up a significant 96% W/W, continuing to push 5G. Surprisingly, Verizon remains quiet for the 4th week in a row.

  • HP and Dell continue to market remote business solutions. Dell up a significant 50% W/W with its highest week of the year. 

Below is a view of the top 50 advertisers, based on spend. The right column compares Y/Y trends of the 4 week average of Weeks 41-44 2020 vs 2019. The left column compares W/W trends from Week 44 vs Week 43.

The Grand Total represents the entire Advertiser dataset.

Top Gainers and Decliners

adv 11.3.png

Fashion Tip: Slippers Out, Sneakers In

bd488021-85f4-4c05-8d63-ac742807e5fd.jpg

Advertiser Data: Biggest Movers

Week 42 displayed a steady increase in CPMs that continued from last week. Some categories stood out this week. Beauty & Fitness are up significantly this week, and Pharmacies saw a bump from in-person healthcare and the flu shot. 

*As the election nears, we are interested in if/how advertiser strategies will be impacted. Thus far we’ve heard some advertisers may pause close to the election. They may also choose to avoid election specific content. We would love to know if you’ve heard about any plans shifting around the election. Please submit your response here, and we’ll share the responses next week.

For direct access to your BMX dashboard contact your company Admin or reach out to Support@staq.com

At A Glance: 

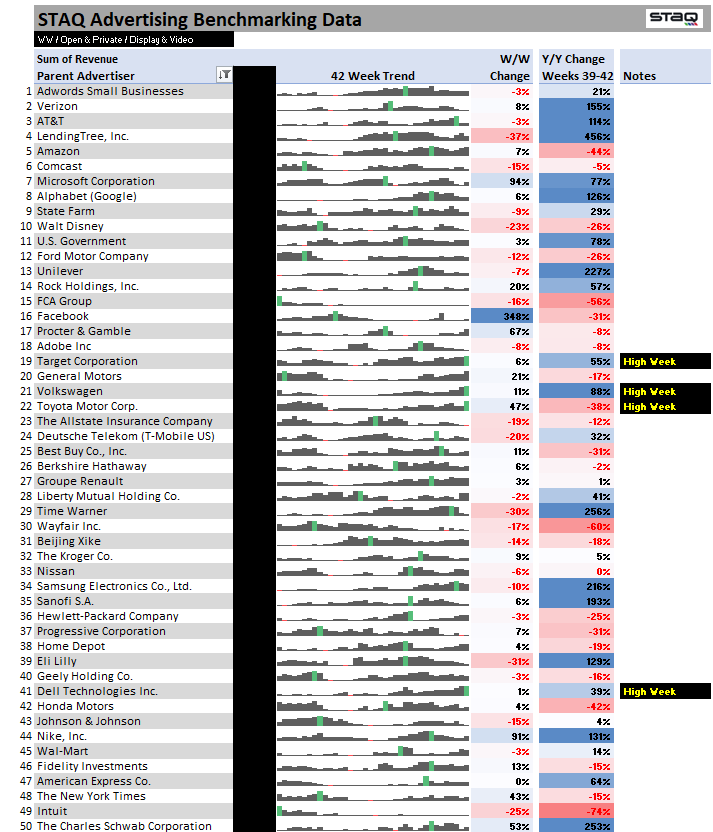
  • Sneakers on Zoom. A welcome pop this week from Apparel and Retail who had their highest week of the year. They are led by The Gap, Adidas, and Nike up 90% W/W. 

  • Vehicles continue to significantly increase with 3 of the Top 50 Auto advertisers up double digits W/W. VW and Toyota (up 50%) both had their highest spending weeks of 2020.

  • Entertainment down 30% this week. With big budget theatrical releases pushed to 2021, advertising increases in this category will be dependent on streaming services. Note: Be on the lookout for long awaited Coming 2 America to be released on Amazon on Dec 18. (Someone at STAQ is particularly excited about this one)

Below is a view of the top 50 advertisers, based on spend. The right column compares Y/Y trends of the 4 week average of Weeks 39-42 2020 vs 2019. The left column compares W/W trends from Week 42 vs Week 41.

The Grand Total represents the entire Advertiser dataset.

Top Gainers and Decliners

10.20.png

Q4 Starts Today

bd488021-85f4-4c05-8d63-ac742807e5fd.jpg

Advertiser Data: Biggest Movers

Q4 2020 began slowly with advertisers seeming to continue their Q3 plans, and not displaying the usual increases attributed with Q4 spending. However, the market is still showing surprisingly positive signs. The typical CPM drop at the beginning of a new quarter wasn't as precipitous entering this Q4. Large categories like Vehicle brands have rebounded, nearly returning to Q1 revenue share levels. 

This slower start may be due to delayed product releases and tentpole events that garner advertising spend. With Apple and Amazon’s major launches this week, we expect Q4 to finally start and programmatic advertising to rise this week.

At A Glance: 

  • Prime Day today! Amazon up 15% W/W with the start of Prime Day. This event bolstered overall CPMs in the Open market by 13% in 2019, and expect to see a similar impact this year (and this week).

  • Following a similar trend to 2019, Verizon down 20%, and AT&T down 60% W/W. However, we expect them to pop back up with the new iPhone release tomorrow.

  • Political Spend took a hit last week, likely a result of Trump’s Covid diagnosis, and his reallocation of campaign funds. Biden was down 6% while Trump was down 77% W/W.

Below is a view of the top 50 advertisers, based on spend. The right column compares Y/Y trends of the 4 week average of Weeks 38-41 2020 vs 2019. The left column compares W/W trends from Week 41 vs Week 40.

The Grand Total represents the entire Advertiser dataset.

Top Gainers and Decliners

1016.png

Q3 Recap & Report

bd488021-85f4-4c05-8d63-ac742807e5fd.jpg

Q3 Recap

As we start a new quarter, we’re taking a short look at the most significant trends from Q3 that may have an impact on the rest of the year. 

Despite ending Q2 with uncertainty around advertiser confidence and market recovery, Q3 exceeded expectations. Overall, Q3 saw Revenue and CPMs recover from April lows and hit yearly highs.  We saw more large advertisers returning, and continued spend from 2020 standouts like LendingTree. Political Advertising began to pop in September, and will continuously increase until the election. 

In This Brief Report You'll Discover: 

  • Revenue trends across the industry

  • How much device CPM's have changed over the last quarter

  • A handful of categories that may provide opportunities in Q4

  • What Political PACs are spending and which advertisers are hot heading into Q4

We anticipate the positive momentum of Q3 to continue into Q4.

q3.png
  • Revenue finally surpassed 2019 in week 30 (end of July).

  • CPMs increasing weekly since the start of Q3, hitting a 2020 high and surpassing 2019 at the end of September. 

  • All screens now cost the same. In Q3, for the first time, device CPMs converged. 

Q3 Advertisers Y/Y: 

  • After significantly slowing spend in Q2, Auto started to make a comeback with all 9 auto advertisers in the Top 50 up in Q3. Renault and Nissan both up ~300% Q/Q.

  • Procter & Gamble stopped spending in the beginning of Q3 while Unilever is up 225% and Kimberly Clark is up 400% Q/Q.

  • Computers/Electronics saw big increases for BTS and virtual learning/remote working from HP and Dell both up 60+% Q/Q. 

CPM's Soar As Advertisers Reset For Q4

bd488021-85f4-4c05-8d63-ac742807e5fd.jpg

Advertiser Data: Biggest Movers

Week 39 displayed a milestone with CPMs hitting a yearly high. However, revenue remained primarily flat W/W, with 50% of the Top 50 advertisers up on a W/W basis.

We did see positive trends with Consumer Electronics and Vehicle Brands, and are seeing Political PACs start to increase momentum. We anticipate an increase in spending as the new quarter begins this week. 

At A Glance: 

  • Vehicles up 15% W/W as brands finally rev up spending. 8 of the 9 Auto Advertisers in the Top 50 are up W/W, with Groupe Renault, VW and Nissan all up 30+%. 

  • New product releases for Apple and Samsung in Sept & Oct driving growth in Consumer Electronics. Samsung up a significant 41% W/W with their highest week of the year. 

  • Big week for Wayfair up 53%, and eBay (just out of the Top 50) up 36% and hitting a high week. It’s likely we’ll continue to see an increase from advertisers with an e-comm focus this holiday season.

Below is a view of the top 50 advertisers, based on spend. The right column compares Y/Y trends of the 4 week average of Weeks 36-39 2020 vs 2019. The left column compares W/W trends from Week 39 vs Week 38.

The Grand Total represents the entire Advertiser dataset.

Top Gainers and Decliners

929.png

STAQ's Guide To A Monster Q4

bd488021-85f4-4c05-8d63-ac742807e5fd.jpg

Get Ahead In Q4:

A Look At 2019 Top Q4 Advertisers

As we quickly approach the start of Q4 (almost through 2020!) We are reviewing the top advertisers from Q4 2019 with the goal of uncovering opportunities for the rest of this year. All year, advertisers have valued flexible planning/budgets, and hope this offers a helpful tool as they continue to implement spending in Q4.  We hope this information offers actionable direction that helps you have a successful Q4 2020!

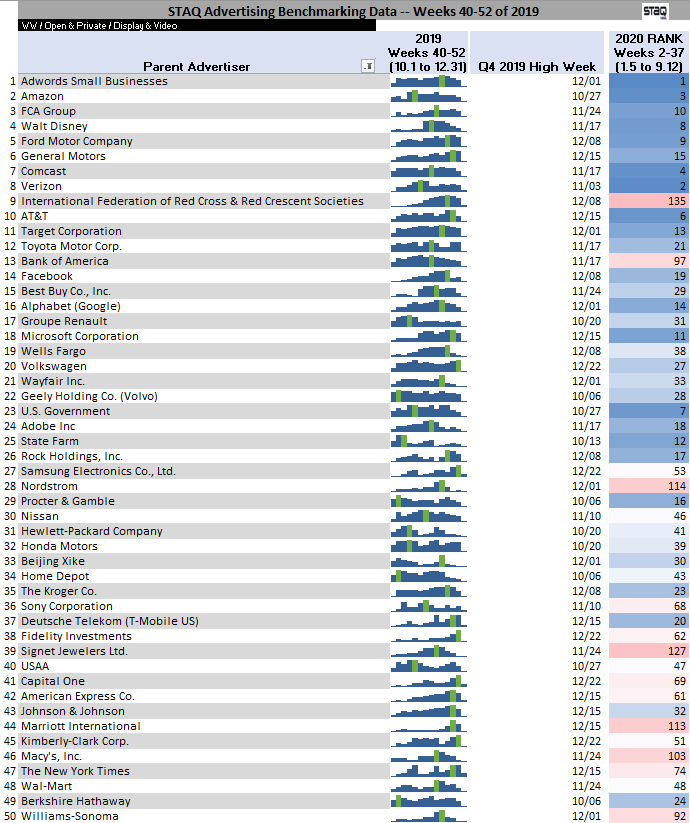
The chart below is last year’s Top 50 from Q4. It represents a typical mix of Q4 advertisers and a good indication of those likely to spend heavily this year. Only 11 advertisers peaked in October with the majority displaying their highest weeks in November and December. Additionally, there are advertisers not represented below that we’ve seen spend significantly all 2020, and will likely continue in Q4. 

8dbecc45-b96d-493f-bb79-fbfa7f9e2297.png

**The green bar represents the advertiser's Peak Revenue Week

Advertisers New To The Top 50 In 2020: 

  • Unilever: #72 to #22

  • LendingTree: #57 to #5

  • Liberty Mutual: #83 to #37

  • Eli Lilly: #67 to #25

  • AllState: #62 to #26

New 2020 Opportunities: 

  • Last year, we observed a revenue peak in weeks 46 - 51 which included Black Friday and Cyber Monday. With both holidays being more e-commerce focused in 2020, we may see retail dependent advertisers increase their programmatic spend. 

  • Biden and PACs already started to increase spend over the last 2 weeks and we expect Political advertising to continue to trend up until the election. Possibly helping boost Q4 CPMs for News Pubs running up to Nov 3rd.

  • Apple typically spends around their big product releases. While they've begun promoting the Watch, the new iPhone release has moved to October this year. 

  • Sony & Microsoft have major releases for the highly anticipated PS5 and XBOX in November, Activision and other game developers have new games launching for the platforms.

  • Moderna, Pfizer, Novavax, AstraZeneca all have the potential to have a vaccine ready for distribution in Q4 2020.

How To Read The Chart:

·   The advertiser list includes the Top 50 spenders (from our dataset) in Q4 2019

·   The 2019 weekly trend lines show spend fluctuations from Oct-Dec with the green line representing that advertiser’s peak revenue week, which is also called out next to it.

·   The last column represents where those advertiser’s rank in 2020 through week 37

HBO MAXimizes, Biden Spends, CPMs & Revenue Pop

bd488021-85f4-4c05-8d63-ac742807e5fd.jpg

A Note About the Data: We have been sharing YoY shifts in advertiser spend on a rolling four week basis. Given some of the impressive gains when looking at advertisers like Lending Tree, we want to contextualize these trends relative to the larger dataset and market. For all of the large gainers, there are large decliners as well. The view we share via email contains only the top 50 advertisers who: may have a different product suite to market in the prior year, have recently made a move towards or away from programmatic and we are seeing a resulting share shift, or like many others may be responding to Covid by increasing or decreasing spend. The grand total at the bottom represents the entire Advertiser dataset.

To provide a more comprehensive view, an expanded list of the Top 100 advertisers is below.

Advertiser Data: Biggest Movers

Week 37 had the highest CPMs of the year so far and Revenue up 13%YoY! While this week does encompass part of the slower Labor Day holiday, we saw 27 of the Top 50 advertisers up W/W. Political advertising is starting to pop with Biden and the DNC registering spend. As a baseline is established, we will continue to call out political spend in the weeks to come.

Special Report Available Next Week: Head Start On Q4, A Look At 2019 Top Q4 Advertisers

At A Glance: 

  • Keep on streaming. Time Warner up 14% W/W hits its highest week of the year driven by HBO Max.

  • After a slow 4 weeks, Verizon up 39% preceding their TracFone announcement this week or maybe ramping up competition with AT&T again.

  • FCA, Ford, GM, and Volvo (Geely) all up this week driving gains for Vehicle brands. 

Below is a view of the top 50 advertisers, based on spend. The right column compares Y/Y trends of the 4 week average of Weeks 34-37 2020 vs 2019. The left column compares W/W trends from Week 37 vs Week 36.

The Grand Total represents the entire Advertiser dataset.

Top Gainers and Decliners

Top 50 Weekly Gainers & Decliners 9.9

bd488021-85f4-4c05-8d63-ac742807e5fd.jpg

Advertiser Data: Biggest Movers

Week 36 displayed slower advertiser spending associated with the Labor Day Holiday and opportunities to enjoy the outdoors. 74% of the Top 50 advertisers were down on a W/W basis.

We did see positive trends with Back To School, but we will have to wait until next week to see which large and consistent advertisers return post holiday. We expect things to pick up, and Mid-September to be strong.

At A Glance: 

  • Big week for Mickey+. Disney up 52% with the anticipated release of Mulan. They are driving the Entertainment category up 33% W/W.

  • BTS and virtual learning helped drive Consumer Electronics to its highest week of the year. Best BuyHP, and Samsung all up over 20% W/W. 

  • After Verizon and AT&T spending big for much of the year, T-Mobile coming back up 119% W/W and their highest week of the year. 

Below is a view of the top 50 advertisers, based on spend. The right column compares Y/Y trends of the 4 week average of Weeks 33-36 2020 vs 2019. The left column compares W/W trends from Week 36 vs Week 35.

Top Gainers and Decliners

Picture1.png

Weekly Advertiser Gainers & Decliners 8.25

bd488021-85f4-4c05-8d63-ac742807e5fd.jpg

Advertiser Data: Biggest Movers

Week 34 continued to display interesting August trends, with CPMs increasing over the last 4 weeks, and displaying their highest week of the year (so far). We anticipate News publishers could make up for volatility earlier in the year with Politics looking to ramp up post Labor Day. 

Keep an eye out for our next newsletter the week of 9/7. We hope everyone enjoys their Labor Day!

At A Glance: 

  • Following up on last week’s return of AmEx for the first time since Q1, they are up a significant 168% W/W. Along with Wells Fargo and Fidelity, they are driving the Finance category, all with their highest weeks of the year.

  • Pfizer & J&J with a possibility of green light on a Covid vaccine. Will these big advertisers break the top 10 before end of year? Or will there be little need to promote what we all want? 

  • Food & Grocery, Beverages, and TV & Video all down over 20% this week. Perhaps waiting for consumers to return from summer vacations and begin the school year. 

Below is a view of the top 50 advertisers, based on spend. The right column compares Y/Y trends of the 4 week average of Weeks 31-34 2020 vs 2019. The left column compares W/W trends from Week 34 vs Week 33.

Top Gainers and Decliners

825.png

Newsletter 8.18

bmx.png

2020 & 2019 Weekly CPMs

This week we explore weekly and YoY CPM trends. The most notable takeaway is that despite being down from 2019 levels, 2020 CPMs are following the EXACT same trends as last year. If this continues, we should see a healthy CPM increase during Q4. And if our publishers are right, possibly hitting 2019 levels with advertisers looking to make up spend and drive sales.

mm.png
  • CPMs started the year in line and slightly up over 2019 levels before precipitously dropping around Week 11 due to COVID. 

  • Week 16 CPMs were down 41% YoY.

  • CPMs started climbing in Week 23 and have been in lock-step with 2019 trends over the last 11 weeks. 

  • CPMs in the last 11 weeks have been returning to Q1 2020 levels, but are still 20% below last year.

Device Type: Desktop & Mobile

mm1.png
  • Desktop and Mobile CPMs began converging around Week 17 with Mobile CPMs only 5% below Desktop by week 20. The CPM gap widened to 13% by Week 33.

  • Mobile CPMs have displayed more resilience than Desktop in 2020, with Mobile CPMs surpassing pre-COVID levels by week 25 while Desktop continues to struggle to meet pre-COVID CPMs.

Creative Size CPMs YoY

mm2.png
  • 2020 Video CPMs are 40% below 2019 CPMs dropping ~$3.30 in 2020. Video CPMs are unlikely to recover to 2019 levels.

  • 300x250 is 22% below 2019, but has been gradually increasing in the last 5 weeks.

Advertiser Data: Biggest Movers

You can view this week’s Top 50 Advertisers Gainers and Decliners chart here.

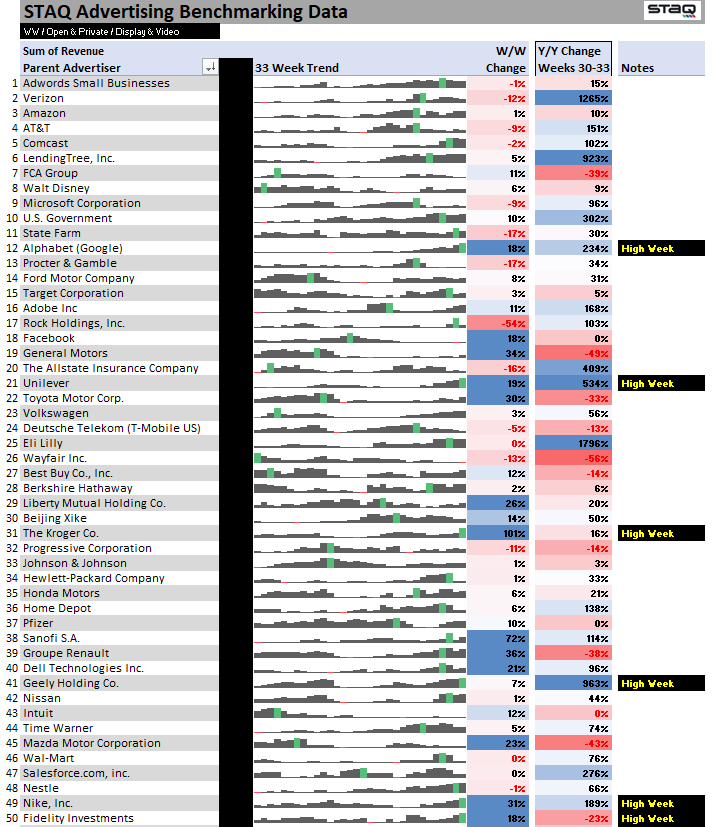
The right column compares Y/Y trends of the 4 week average of Weeks 30-33 2020 vs 2019. The left column compares W/W trends from Week 33 vs Week 32.

At A Glance: 

  • Not highlighted in today’s table, but important to know CPMs have been making a comeback with some unusual summer peaks.

  • Unilever is having a big summer with high levels of spend, up 19% this week, while P&G is dark or avoiding programmatic.

  • Seeing activity in the Finance category, outside of Lending Tree, with steady increases from Wells Fargo and Fidelity Investments, both hitting new 2020 highs. American Express has finally made a reappearance returning to mid-March levels this past week. 

Top 50 Weekly Gainers & Decliners 8.11

89e32bf3-57b6-44d4-af81-f4747efe98c1.png

Advertiser Data: Biggest Movers

You can view this week’s Top 50 Advertisers Gainers and Decliners chart here. The right column compares Y/Y trends of the 4 week average of Weeks 29-32 2020 vs 2019. The left column compares W/W trends from Week 32 vs Week 31.

At A Glance: 

  • 36% of the Top 50 are up well over 100% Y/Y, lending credence to the theory that advertisers need to play catch up by spurring sales.

  • Lending Tree, Verizon, Eli Lilly, Geely (Volvo), all up over 1000% Y/Y, and contributing significant spend.

  • Wells Fargo is up 46% this week. However, they are down 43% Y/Y after being surprisingly absent recently. 

111.png

Top 50 Weekly Gainers & Decliners 8.4

bd488021-85f4-4c05-8d63-ac742807e5fd.jpg

Advertiser Data: Biggest Movers

Week 31 displayed steady revenue trends led by Finance, Pharma, Apparel, Entertainment and Software all showing low double digit gains over last week. We saw Government, Internet & Telecom, Conglomerate, and Wireless all declining on a Week over Week basis. That said, the week showed continued momentum compared to the first half of July. And we expect the trend to continue into August.

But first a brief note about Facebook: We looked at the advertisers who participated in the Facebook ban to see if there was a shift in spend towards Programmatic. We placed this subset of advertisers in their own category during the month of July. While we did see total spend within this category up ~3%, there was not a significant variance from the overall dataset which was up ~6%. Therefore, it does not seem that our publishers were the direct beneficiaries of the shift in ad spend.

At A Glance: 

  • After dominating the Finance category over the last 10 weeks. Likely driven by low interest rates, Lending Tree finally has buying competition with Rock Holdings (Quicken Loans). They are up 92% W/W and moved up to the 16th spot.

  • Getting creative again. Adobe up 29% W/W after a slow 10 weeks. The market is ripe for their Creative Cloud with Back To School and continued WFH.

  • Peacock driving Comcast to their highest week of the year, up 10% W/W.

  • Other notable gainers: Kohl’sGap, and McDonald’s with their highest weeks of the year and a good sign for Retail and Restaurants.

Below is a weekly view of the top 50 advertisers, based on spend. The right column compares Y/Y trends of the 4 week average of Weeks 28-31 2020 vs 2019. The left column compares W/W trends from Week 31 vs Week 30.

Top Gainers and Decliners

84.png

Top 50 Weekly Gainers & Decliners 7.28

bd488021-85f4-4c05-8d63-ac742807e5fd.jpg

Advertiser Data: Biggest Movers

Week 30 showed some of the best signs that advertiser spending and confidence has returned. With revenue up 13% overall, and 10 of the Top 50 advertisers having their highest weeks of the year, we are hopeful these are signals of a strong Q3/4.

As we came upon our 15th Advertiser Report, we continued to strive for the best way to provide you with the most actionable and strategic view of this data. In an effort to deliver maximum value we have changed things up a bit. Our new views of the Top 50 advertisers spending right now are explained below. 

Below is a weekly view of the top 50 advertisers, based on spend. The right column compares Y/Y trends of the 4 week average of Weeks 27-30 2020 vs 2019. The left column compares W/W trends from Week 30 vs Week 29.

At A Glance: 

  • Road trip! 8 Auto advertisers in the Top 50 up W/W finally showing the category growth we’ve been waiting for. Nissan continues their upward trend with a 93% increase this week.

  • This round is over. After duking it out over the last few months, Verizon continues to have a strong presence in the market up 25% W/W, while AT&T has been noticeably absent in programmatic the last few weeks. 

  • Expedia up 20% W/W as they aim to gain share and loyalty. 

  • The mind of Bill Gates... Microsoft, a usually consistent spender, declined over the last 3 weeks before returning this week up 12%.

  • As competition pushes spending, HP & Dell up over 25% W/W and having their highest weeks of the year.  

  • Wells Fargo returns to the Top 50 for the first time in 6 weeks and up 78% W/W with its highest week of the year.

Next Up: Our 1H 2020 Report will be released this week. Please keep an eye out for our recap analysis. We hope you like it!

If you’d like to check out other STAQ resources and reports, you can find them here. We will continue to add new content, so keep checking back!

Top Gainers and Decliners

7.28.png